Quantifying Bill’s Value to Hillary’s Campaign (Part I)

In presidential elections, relationships matter.
For example, political scientists know that the relationship between economic conditions, the number of causalities in war, and the incumbent’s party affiliation explain the bulk of presidential election outcomes.
In the 2016 presidential election, however, there is another “relationship” worth keeping an eye on. But rather than the correlation between two variables, this relationship is of the social variety. I’m referring, of course, to the marriage of Bill and Hillary Clinton.
Pundits on the left claim that Bill Clinton is an asset to Hillary because he brings legions of faithful supporters and has a high approval rating. Pundits on the right claim that Bill Clinton is a liability because he reminds voters of the Clintons’ personal affairs.
But when we strip this rhetoric down to its core, both sides are making the same empirical point: As goes Bill, so goes Hillary.
But is it true? Are the Clinton’s’ “married” in the minds of voters such that the opinion of one affects opinions of the other?
In the figure bellow, I plotted approval ratings from Gallup.com (here and here) and Pollster.com (here) from 1992 to 2014 and created smooth trend lines for both Clintons. According to the figure, the answer would seem to be very clearly “yes.” We can see that Bill’s approval rating moves up and down alongside Hillary’s approval rating.

Surprised? No? Let’s get a little deeper into the data.
For starters, two variables can move up and down together without being causally related. In fact, causal relationships are notoriously hard to identify in non-experimental data (see an old post of mine on the relationship between Nickleback, Herpes, and Obama’s vote share in 2012). Indeed, other factors could be causing the above patterns. In other words, it’s possible the above patterns are a “spurious relationship.” But also, the question here is about an individual-level relationship (what happens in the minds of voters). Inferring an individual-level relationship from aggregate data can lead to what’s known as an “ecological fallacy.”
In short, we need better data.
Fortunately, the American National Elections Studies (ANES) has been conducting surveys for every presidential election from 1948-2012. We can easily download the ANES dataset and quickly produce some answers to this question.
Let’s explore the relationship between opinions of Bill and Hillary Clinton in 2000. Respondents’ opinions are measured using a “feeling thermometer” where a score of “100” indicates the highest possible approval of the Clintons while a score of “0” indicates the lowest possible approval. A simple regression analysis will tell us if these two variables are indeed related and whether that relationship is statistically meaningful or not. Here are the results:

I’ll skip the boring statistical details, but basically the regression model confirms what we see in the approval data. It would seem that that there is a very strong positive relationship between opinions of Bill and Hillary Clinton (indicated by the number 0.77 in the column “Coef”). We can also see that this relationship is statistically meaningful (indicated by the number 38.95 in the column “t”). In sum, as Bill’s approval goes up, Hillary’s increases, and as Bill’s approval goes down, Hillary’s declines as well.
But what about all the “other factors” that could be causing opinions of both simultaneously? For example, perhaps both are caused by views of Democrats in general, raw party identification, or the performance of the economy. In the social sciences, we call these “control” variables.
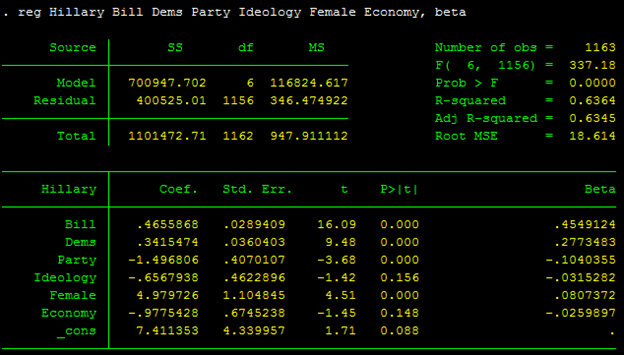
In the model below, I added five control variables (opinions of the Democratic Party, opinions of the economy, a respondent’s party identification, ideology, and gender). Here are the results:

Among the control variables, Democrats, respondents with a favorable opinion of Democrats, and women all have a higher opinions of Hillary Clinton. None of this is surprising, but again, it’s important to account for these relationships.
But what’s most notable about the results is the magnitude of Bill’s effect. Indeed, from the above results we can quantify Bill’s value to Hillary’s campaign (as the title of this post suggests). In particular, because the coefficient on the “Bill” variable is 0.465, the model indicates that as Bill’s approval rating increases by 1 unit, Hillary’s approval increases by just under ½ in the same direction.
So while it’s not a 1-to-1 relationship, Bill has a sizable effect on how people view Hillary. Moreover, we when look at the last column on the right (labeled “beta”), what we see is that Bill’s effect is larger in magnitude than any other variable in the model. So not only does Bill matter, but he matters quite a bit.
Interested in one more model? Actually, you don’t have a choice.
For some additional context on the magnitude of Bill and Hillary’s “statistical” relationship, I wanted to see what happened if we used the same model to predict opinions Al Gore. Here are the results:

We would expect Bill Clinton to have an effect on Al Gore’s approval rating given that they shared the White House together (remember, these data were collected in 2000). And indeed, that’s what we see in the results. However, what’s notable is that the magnitude of this relationship has decreased by about 30% from what the same model predicts regarding Bill’s effect on Hillary (from 0.465 to 0.320). In short, the statistical relationship between Bill and Hillary’s approval ratings is larger in magnitude than the statistical relationship between Bill and his Vice President.
What’s the big takeaway? In short, yes, opinions of Bill Clinton seem to sway opinions of Hillary. While we can’t say definitively this is causal (for example, causality could go the other way, with opinions of Hillary could be affecting Bill’s), this relationship persists even when we control for various factors. Perhaps most importantly, the effect is surprisingly large in magnitude. It would seem that Hillary earns about a ½ increase or decrease in her approval rating for every 1 unit change in Bill’s approval rating. In the 2016 campaign, the so-called “Bill factor” would matter quite a lot.
For next week’s post:
What happens after Bill left office? Does this relationship exist in, say, 2008?
Does this statistical relationship translate into actual votes?
Is Bill’s effect strongest for Democrats, Independents, or Republicans?
| Topics: | Oversight |
| Tags: | Rule 22 Blog |